Can We Make Housing Affordable in Montana?
By Bryce Ward
Buying a house in Montana can be hard. A recent Gallup study found 45 percent of Montanans were dissatisfied with the availability of good affordable housing. This tied Montana with Maryland and Oregon for eighth worst in the country.
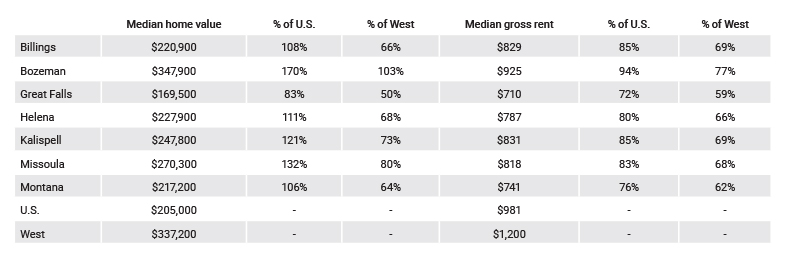
In many Montana markets, prices are high. As shown in Table 1, prices are high relative to other parts of the country. Home prices are also high relative to the incomes typically earned by Montanans, relative to the cost of building a house, and they are also much higher than they used to be.
 Table 1. Housing costs in Montana relative to the U.S. and other Western states. Source: BBER analysis of 2016 American Community Survey (1-year).
Montana renters fare better. Rent in Montana markets tends to be lower than in other parts of the county. Montanans are less likely than the average American renter to be rent burdened (spending more than 30 percent of their income on rent). However, Montana’s median gross rents have been rising faster than across the country.
Combined, Montana’s owners and renters spend a higher percentage of their income on housing than they did 25 years ago. In 1990, Montana was one of the most affordable states, but its affordability advantages have eroded. Given these challenges some have wondered what, if anything, can be done to ensure housing in Montana is affordable?
Standard economic logic suggests increasing affordability requires slowing housing price growth, while also boosting income growth – this is difficult. Slowing housing price growth entails limiting demand (making Montana less desirable) or increasing the supply response (making it easier to build).
Thus, those seeking to improve affordability must ask two questions: 1) Can we reduce demand – can Montana become less desirable and do we want it to be less desirable? 2) Can we increase supply – can Montanans make it easier to build more housing?
Housing Demand
Places with strong demand experience either population growth or housing price growth or both. Based on these metrics demand for Montana is strong. Over the past 25 years, Montana has enjoyed both faster-than-average population growth and faster-than-average housing price growth.
Productivity and quality of life drive demand for place. Places that are very productive (i.e., places that produce lots of value per worker) tend to offer high wages and good job opportunities. As such, they tend to attract people. Similarly, places that offer an appealing quality of life also tend to attract people.
Demand growth in Montana reflects some productivity improvements, but mostly it reflects demand for Montana’s quality of life. Productivity and wages have grown relatively quickly in Montana over the past 15 years. For instance, while wages in Montana remain low, average wages have grown faster than across the country. In 2000, average weekly wages for Montana’s wage and salary workers were only 69 percent of the U.S. level. In 2016, they were 76 percent of the U.S. level. This faster than average wage growth could contribute to demand for Montana.
Demand for the quality of life, though, is likely the stronger force driving demand – many people come to Montana just for that. But this demand creates some specific challenges for the state’s economy.
Some portion of those who seek to enjoy Montana’s quality of life do not rely on the state’s economy for income. This group includes out-of-state residents who own second homes in Montana, people whose income comes from savings (e.g., capitalists or retirees) and telecommuters. While it is hard to precisely identify the size of this group in the available data, several pieces of evidence suggest this group is relatively large.
First, Montana has a larger-then-typical share of second homes and the number of second homes has grown at a relatively fast rate. In 1990, the census classified 5.8 percent of Montana homes as seasonal, recreational or occasional use. This was nearly double the U.S. share (3 percent). By 2010, the share of second homes in Montana grew to 8 percent, while the U.S. share grew to only 3.5 percent.
Second, Montana appears to have attracted a growing number of people who have the means to live wherever they choose (e.g., capitalists, retirees and telecommuters).
The Treasure State has a larger than typical share of income from non-wage sources. Twenty-three percent of Montana’s personal income comes from dividends, interest and rent. This is higher than the U.S. level (19 percent) and ranks third highest among all states. Thirty Montana counties, including Flathead, Missoula and Gallatin, rank in the top 10 percent among all U.S. counties in the share of personal income from dividends, interest and rent.
Similarly, the share of income reported to the IRS from non-wage sources is significant and has grown over time. In 1990, 31 percent of Montana’s total adjusted gross income (AGI) was from non-wage sources. By 2015, this share had grown to 36 percent. In 19 Montana counties, including both Gallatin and Missoula counties, over 40 percent of AGI comes from non-wage sources. These counties all rank in the top 10 percent of counties.
Thus, Montana’s rising housing costs, in part, reflect Montana’s desirability to people whose income is not derived from the state’s economy. While demand from these footloose individuals provides clear evidence that Montana offers a great quality of life, it also makes housing in Montana more expensive, which can create problems. It means that housing cost increases may not be tethered to wage increases. This can make Montana untenable to certain workers and firms.
In theory, Montana could try and avoid such problems by becoming less attractive – i.e., by becoming less productive or by lowering the quality of life. Neither of those outcomes are enticing. Thus, it is difficult to argue that the state should try to improve housing affordability by reducing demand, but what about supply?
Housing Supply
When strong demand for a place exists, the range of feasible outcomes is bound by two extremes. At one extreme, strong demand is met by very little increase in the number of houses. In this case, strong demand leads to big increases in housing prices, but very little population growth. At the other extreme, strong demand is met by a very large increase in the number of houses. In this case, strong demand leads to big increases in population, but very little housing price growth.
Whether demand for place translates into an increase in housing prices or an increase in population depends on the number of houses that get built. That is, for a given change in demand, the price response depends on the supply response.
Supply response varies widely across the country. Some communities are expensive (e.g., San Francisco). They have built little, experienced slow population growth, but have seen rapid home price growth. Some communities are expansive (e.g., Las Vegas). They have built a lot, experienced massive population growth, but have seen relatively little home price growth.
Communities across Montana vary in both demand growth and supply response. Table 2 shows housing price growth and housing unit growth between 2000 and 2015 for several Montana communities relative to other places. Each of the listed communities has experienced housing price growth in excess of 50 percent. This places each above the 75th percentile, which tells us that these parts of the state have all experienced strong demand.
 Table 2. Percent change in housing prices and number of housing units, 2000-2015. Sources: BBER analysis of OFHEO Housing Price Index (CBSA), 2000 Census and 2015 American Community Survey. Note: Percentile rank is among metropolitan and micropolitan areas.
The supply response has varied across Montana. The percentage change in the number of housing units in Butte and Great Falls is below average (and well below the average for places who experienced similar housing price growth). Billings, Helena and Missoula all built more than average and ranked in the 75th to 85th percentile in terms of housing unit growth; however, they built slightly less than expected given how much prices increased. Kalispell and Bozeman built an extraordinary amount. Bozeman ranks 10th and Kalispell ranks 26th in percentage change in housing units between 2000 and 2015. Both also built substantially more than average given price appreciation.
The message of these findings is disconcerting. Many places in Montana built a fair amount of housing and yet they still experienced large increases in house prices. Thus, given the level of demand, these communities needed to build more (likely much, much more) if they had wanted to keep housing prices down. The question is why didn’t they build more housing?
Places that make it easier to build have three advantages: First, they have abundant developable land (places with mountains and large bodies of water have a less responsive housing supply.) Second, they have fewer land-use regulations. Third, they have robust development sectors.
Montana cannot do anything about its natural constraints on land supply. But if we want to lower prices or slow price growth, regulatory barriers need to fall or the efficiency of the development sector needs to increase.
Unfortunately, we do not know how many houses need to be built to substantially lower prices. It is hard not to notice that the two areas that built the most housing, Bozeman and Kalispell, experienced some of the largest housing price appreciation in the country. It is worth considering whether building more housing contributed to the growth in demand.
Thus, increasing affordability in Montana may prove difficult. Some degree of unaffordability may be hard to avoid. Montanans, or at least Montanans in certain places, may need to learn to adapt to relatively unaffordable housing.
Bryce Ward is an associate director at the Bureau of Business and Economic Research at the University of Montana.
